


There is no doubt that LinkedIn is the most successful social media channel for B2B marketing. Whether it’s used for content marketing, recruitment or account-based marketing, the opportunities stretch far and wide.
In this three-part blog series, I will cover how to make the most of your LinkedIn company page analytics, best practices for distributing content on LinkedIn and how to use LinkedIn when B2B events or shows are cancelled. This blog post is the first of three and delves deep into LinkedIn analytics.
If you are a company or business, operating locally or globally, a LinkedIn company page is a must-have. LinkedIn has around 690 million users in more than 200 countries and territories globally. In fact, B2B companies identify LinkedIn as the number one lead generator when it comes to social media platforms. It’s a free space for you to distribute thought leadership content, invest in paid advertising, recruit new employees and showcase your value proposition to the wider global audience.
As with any marketing effort, analytics and measurement is essential for checking your effectiveness and return on investment (ROI). What’s the point of dedicating resources to something that is not generating awareness and sales leads?
Measuring success
Company pages on LinkedIn offer analytics that can be used to measure how effective your page is in reaching your target audience. We’re all familiar with likes, shares and comments – it’s been part and parcel of social media interaction since social media channels like Facebook, Twitter and LinkedIn became a part of popular culture. But when it comes to interpreting the other metrics offered by LinkedIn, it can be difficult to know exactly what it all means.
What does it all mean?
LinkedIn analytics offers three high-level metrics: visitors, updates and followers. What is the difference between a visitor and a follower? Put simply, a visitor is just dropping in for a cup of tea, whereas a follower has moved into your home. Followers want to keep a close eye on what your business is doing. Ideally, as part of your LinkedIn strategy, you should aim to convert those occasional tea-drinking visitors into devout followers.
Here’s an overview of how each metric is broken down into even more detailed information and what it means for your company page. Just remember, as a default, the LinkedIn analytics provided are for the last 30 days. In some cases this can be adjusted to cover a longer or shorter timeframe for your reporting purposes.
VISITORS
This metric is broken down into highlights, metrics and demographics. Overall, this section offers valuable insight as to when you get the most visitors to your company page. For example, visits may spike on a Thursday and dip on Mondays. It’s probably safe to say your best day to post is Thursday. Pairing this with checking what type of post it was that performed so well, for example, a blog post, a video, or a photo of your office dog, will help guide what content is popular amongst your audience.
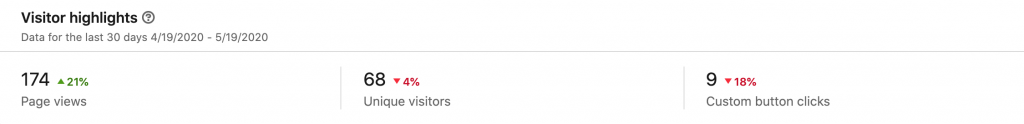
Visitor highlights shows high-level data for the last 30 days. It displays the number of page views, unique visitors and the number of custom button clicks (the custom button can be a call-to-action such as click through to your website). The percentage appearing next to each highlight shows your performance compared with the previous 30 days, with green indicating an improvement and red indicating a decrease in performance.
Visitor metrics offers a more detailed look at the highlights and can be aggregated for mobile or desktop usage. You can also play around with the different filters, including time range, page (all pages, home, about, insights or people) and metric (page views or unique visitors).
The visitor demographics function categorizes your page visitors according to their job function, location, seniority, industry and company size.
UPDATES
Updates refer to the posts you publish on your company page. They are broken down into highlights, metrics and engagement.
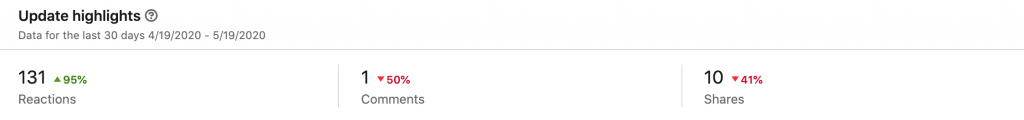
The update highlights function looks at your standard engagement metrics of reactions, shares and comments. The percentage appearing next to each metric indicates the performance of your updates compared with the previous 30 days. It’s good to have a yard stick, right?
Update metrics is where you have the chance to see how your organic posts performed against your sponsored/paid posts (if applicable). You can also see if your updates are being viewed on a desktop computer or on a mobile device.
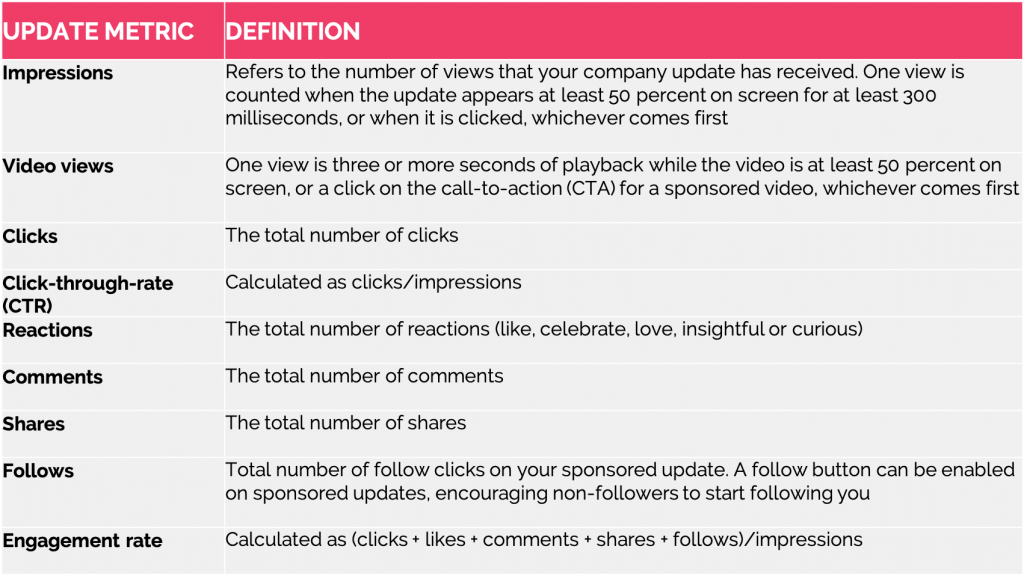
Update engagement goes into quite a lot of detail. It shows how each post has performed in terms of the metrics shown in the table below.
FOLLOWERS
When a person follows your company page, they are essentially subscribing to receive updates on their news feed. Unfortunately, you can’t see your list of followers for a company page, the way you can see your personal connections on your personal LinkedIn page, but you can certainly tap into their demographics.
Follower demographics offers a valuable overview of who is following your company, meaning you can tailor your content to suit your target audience’s needs. This is a key component of account-based marketing or ABM. Instead of publishing generic content that hopefully (fingers crossed) resonates with everybody, targeted content to a specific role at a specific company addressing a specific pain point is imperative.
The follower demographics can also be a good foundation for developing your buyer personas, so that you are developing content that is targeted.
In this section, you can see follower highlights, metrics and demographics.
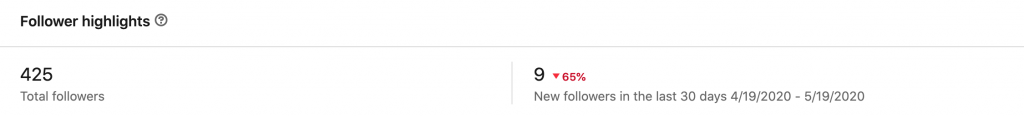
Follower highlights shows your total number of followers and the number of new followers in the last 30 days. An arrow indicates how your gain of new followers has performed compared with the previous 30 days.
Follower metrics shows an overview of new follower activity and can be selected to aggregate organic and sponsored posts.
Follower demographics reveals information on:
- Location
- Job function
- Seniority
- Industry
- Company size
COMPANIES TO TRACK
This is a useful section to see how your company page compares with other companies within your niche. As a content marketing and ABM specialist, we’re likely to see other companies that specialize in the same areas in this section. It shows how these companies are performing in terms of the following:
- Total followers
- New followers
- Number of updates
- Engagement rate
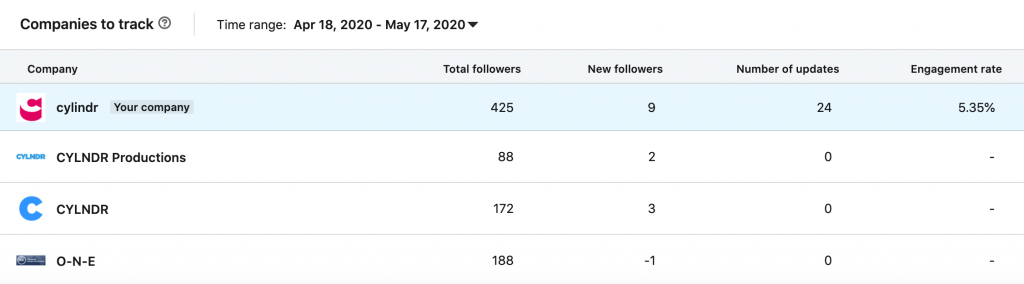
This can be used as incentive to further refine your LinkedIn strategy and can be a source for inspiration, seeing what types of updates they are posting, how frequently they post and which updates perform the best.
What next?
Stay tuned for part two of this three-part LinkedIn blog post series, helping you to unravel the intricacies of this popular and effective social media platform. Next up is best practices on how to share content on LinkedIn.
If you need any help with LinkedIn, whether it be creating the updates for your company page, enhancing your company LinkedIn page or writing content to distribute, we can lend a helping hand. Contact us today for a quote.
Like this post? Subscribe now and get notified about new content!Pha Khem
My career moves to date have taken me from my home town Melbourne, to London and finally to Copenhagen where I work as a copywriter and project manager for cylindr. I’ve worked in both the public and private sector, quite often capitalizing on my communication skills. My interests lie in public health, sustainability and corporate social responsibility. As a qualified dietitian, I enjoy working with food chemistry and human physiology yet can lend a hand with writing highly technical copy for a wide mix of industries.